Chapter 5 — Cathedral Probe
Act III — Understanding · Synthesis chapter · Requires all prior chapters
Core Question
How do you diagnose a renderer that produces wrong pixels without crashing — when you can't afford to run the full oracle on every frame?

Docs/assets/cathedral_probe/cathedral_probe_contact_sheet_row_0015.pngWhat to look at
Inspect: The resonance heatmap — compare the stride=1 row (26% band coverage) against the stride=4 row (0.22%). The collapse is a factor of 100× from a single parameter change. Then look at the continuity vector overlay: the high-magnitude clusters appear at rows ~58 and ~122 — the same instability bands Chapter 4's oracle identified.
Contradiction: The intuitive debug response to banding artifacts is "increase integration precision." The DOE shows this makes the banding worse at stride=1 (finer steps expose more transport boundary structure). The actual fix is changing the traversal schedule, not the integration precision.
What would make it stronger: A four-panel stride comparison (stride=1, 2, 4, 8) rendered at the same step length side-by-side, with band coverage percentages annotated on each panel. The DOE dataset has the numbers; the missing piece is the composite visual.
What the Visitor Sees
The Entry Finding: Scheduler Resonance
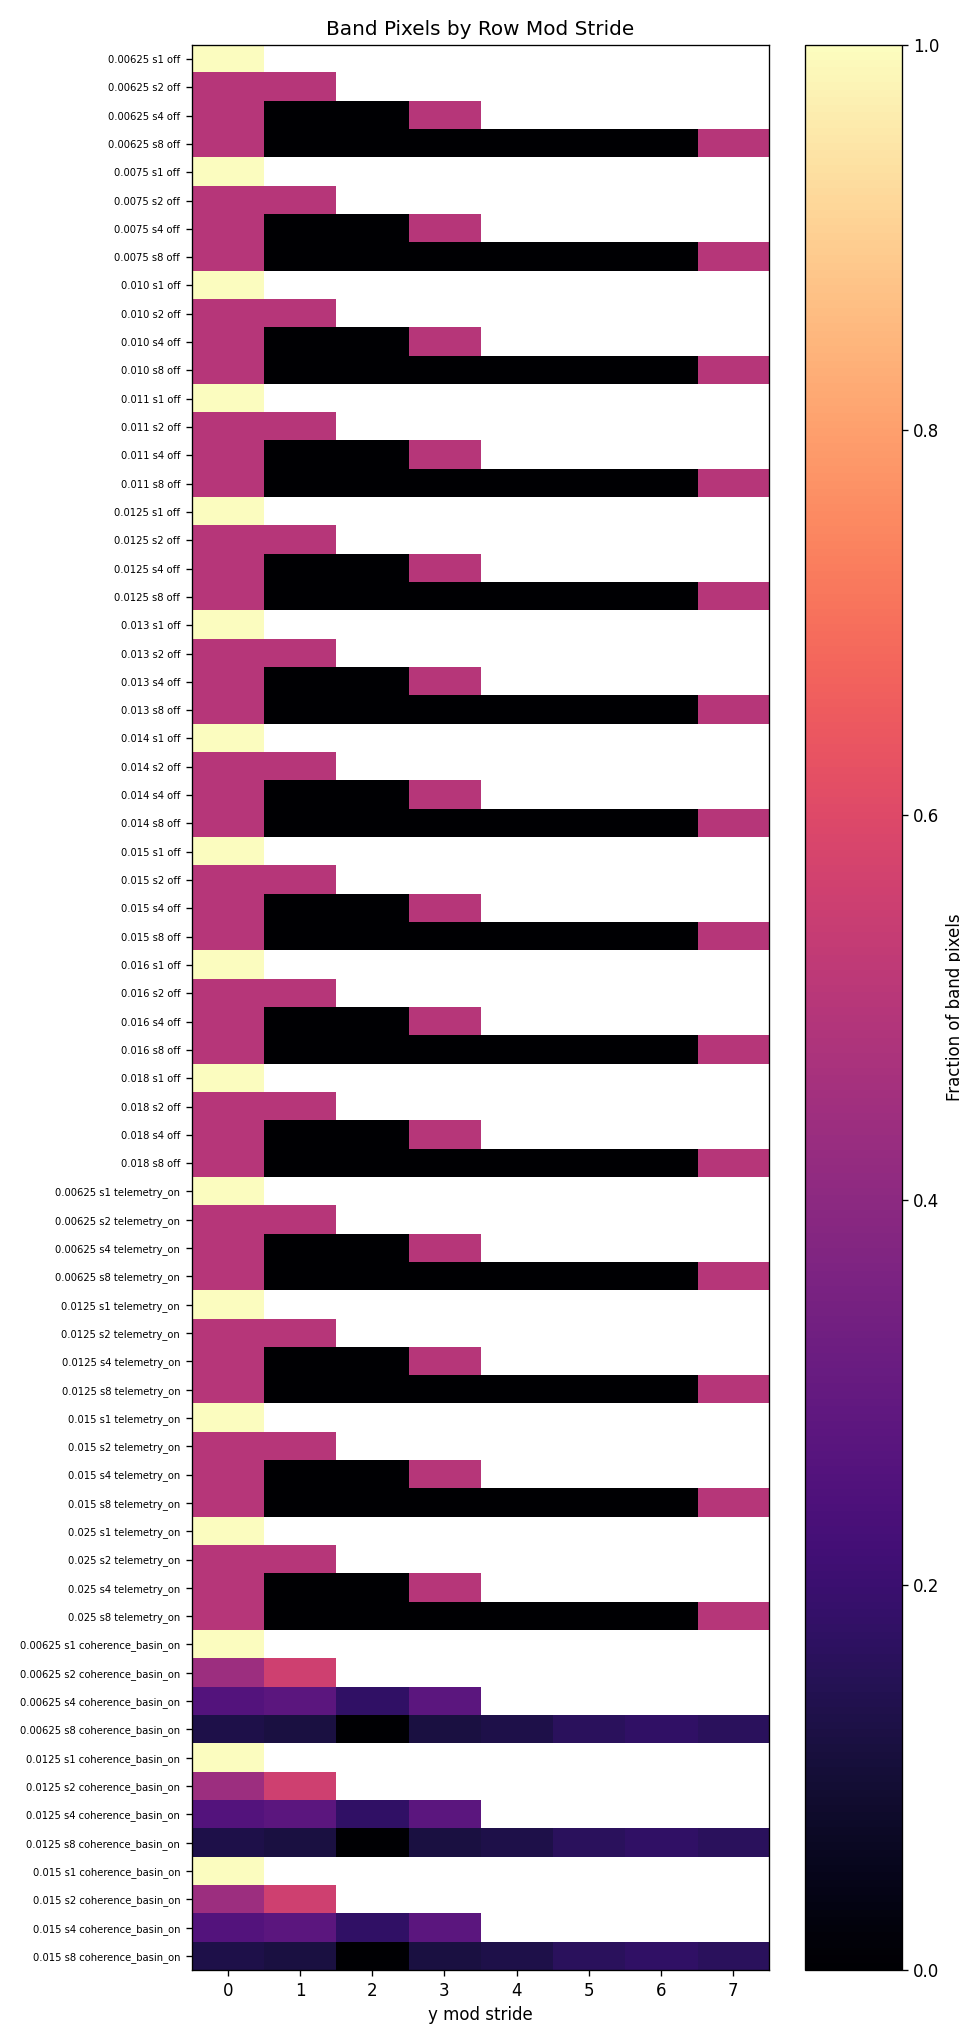
output/doe_scheduler_resonance/20260503T002804Z/The 68-cell DOE Scheduler Resonance experiment revealed a counterintuitive finding: transport banding is controlled by traversal stride, not by integration precision.
| Step length | Stride=1 band % | Stride=2 band % | Stride=4 band % | Stride=8 band % |
|---|---|---|---|---|
| 0.00625 | 22.0% | 26.8% | 0.6% | 0.3% |
| 0.0125 | 33.0% | 18.1% | 0.2% | 0.2% |
| 0.013 | 32.6% | 11.8% | 0.5% | 0.2% |
Band coverage collapses at stride≥4 regardless of step length. Making integration finer increases band coverage because finer steps expose more transport boundary structure, which the row-major scheduler then amplifies. This inverts naive debugging intuition.
The heatmap makes the periodic structure visible: band pixels at stride=2 align with row-mod-2 patterns; at stride=4 the pattern disappears (the band collapses entirely rather than becoming a periodic stripe).
The fix: Scheduler decorrelation. The tile scheduler breaks the row-alignment that enables resonance. Band coverage drops from 20% (row, stride=1) to ~10% (tile). Corner instability (topological) persists unchanged across all modes.
The Six-Layer Cathedral Probe
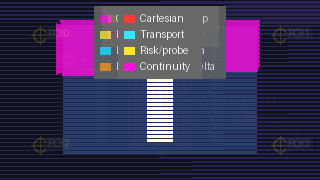
The Cathedral Probe is not a single tool — it is a layered methodology. Six passive instrumentation passes assembled into a composite that makes transport coherence structure legible as a visual space.
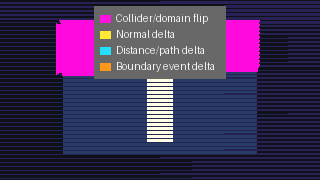
The six layers:
| Layer | Code Name | What it shows |
|---|---|---|
| 1 | Beauty render | Raw integration output — the baseline |
| 2 | Cartesian wireframe | Geometric boundary structure |
| 3 | Transport ownership map | Per-pixel domain ownership coloring |
| 4 | Risk probe markers | High-risk transport nodes from oracle sampling |
| 5 | Spacetime transport diagram | Ray-path topology in scene space |
| 6 | Continuity vectors | Per-pixel transport disagreement across 6 dimensions |
Layer 6 (continuity vectors) is the key non-oracle proxy. Each vector encodes pixel-to-pixel disagreement across collider ownership, domain, hit distance, normal angle, path length, and boundary event. High-magnitude vector clusters appear at the same locations as the Chapter 4 oracle's 289 instability regions — without requiring a separate oracle run.
All six identified transport shape regions confirmed: boundary_aligns_with_high_vector_density = true. The proxy works.
The Link to Chapters 3 and 4
The corner instability visible in the traversal comparison persists across all four traversal modes at 468 ownership-change samples. It is mode-independent — it is the same topological feature Chapter 4's coherence basin oracle identified. The Cathedral Probe finds it; the oracle confirms it; the coherence basin maps it.
Three independent methodologies, same finding.
Artifacts
Promoted (in misterylabs_artifacts/):
| Artifact | File |
|---|---|
| Resonance heatmap | visuals/doe-scheduler-resonance-heatmap.png |
| Stride plot | visuals/doe-scheduler-resonance-stride-plot.png |
| DOE dataset (68 cells) | datasets/doe-scheduler-resonance.csv |
| Card | cards/doe-scheduler-resonance.md |
Canonical images (in Docs/assets/cathedral_probe/):
| Image | Notes |
|---|---|
cathedral_probe_overlay_row_0015.png |
Six-layer composite — the primary diagnostic image |
cathedral_probe_contact_sheet_row_0015.png |
All six layers individually |
continuity_vectors_row_0015.png |
Layer 6 standalone — the non-oracle instability proxy |
traversal_contact_sheet_4mode_0015.png |
Four traversal modes at step=0.015 |
band_support_by_mode_0015.png |
Band coverage reduction: row → tile → checkerboard |
Sample World
cathedral_probe_world — design proposal
Scene: test-domain-resolver-stress.tscn
The world provides individual layer toggles for all six Cathedral Probe components plus a stride selector. The visitor can build the composite progressively or jump to the full overlay. Switching stride from 1 to 4 shows the band-coverage collapse in the step-budget-allocation heatmap before it appears as visible banding in the beauty render.
Build priority: 4. Runtime per-layer toggling requires new implementation.
Validation Question
At stride=4, step=0.015, row traversal: what percentage of pixels should fall in the high-curvature band?
Expected: 0.22–0.45% (from the 68-cell DOE at varying step lengths). At stride=1: 20–33%.
Layer 6 check: Are the high-continuity-vector clusters in the composite aligned with the Chapter 4 instability bands (rows ~58 and ~122)? Expected: yes. The proxy and the oracle should identify the same zones.
Key Insight
Transport instability is not globally smoothable. It is localized, topological, and scheduler-amplified. The right response is scheduler decorrelation first, local precision management second, global smoothing never.
Chapter Synthesis
Chapter 5 closes the Atlas arc.
- Chapter 1 showed that curved transport is beautiful and real.
- Chapter 2 showed it is measurably different from straight transport.
- Chapter 3 showed that "measurably different" is not the same as "measurably correct."
- Chapter 4 showed that some transport regions cannot be corrected by brute force.
- Chapter 5 showed how to find those regions systematically and how the scheduler was amplifying them into global banding.
What comes after Chapter 5: The recursive mirror ghost portal (pending Phase 2 scene build) is the first exhibit requiring all five chapters to interpret. Discrete mirror reflection events + continuous GRIN integration between bounces + hermetic validation + coherence basin mapping + Cathedral Probe diagnosis. It becomes Chapter 6 when its benchmark image exists.
Related Research
- Cathedral Probe Architecture — Full 14-section architecture paper
- Scheduler Decorrelation & Local Coherence
- Traversal Council Review
- Object-Seeded Null Geodesic Scheduler
- Observatory Atlas